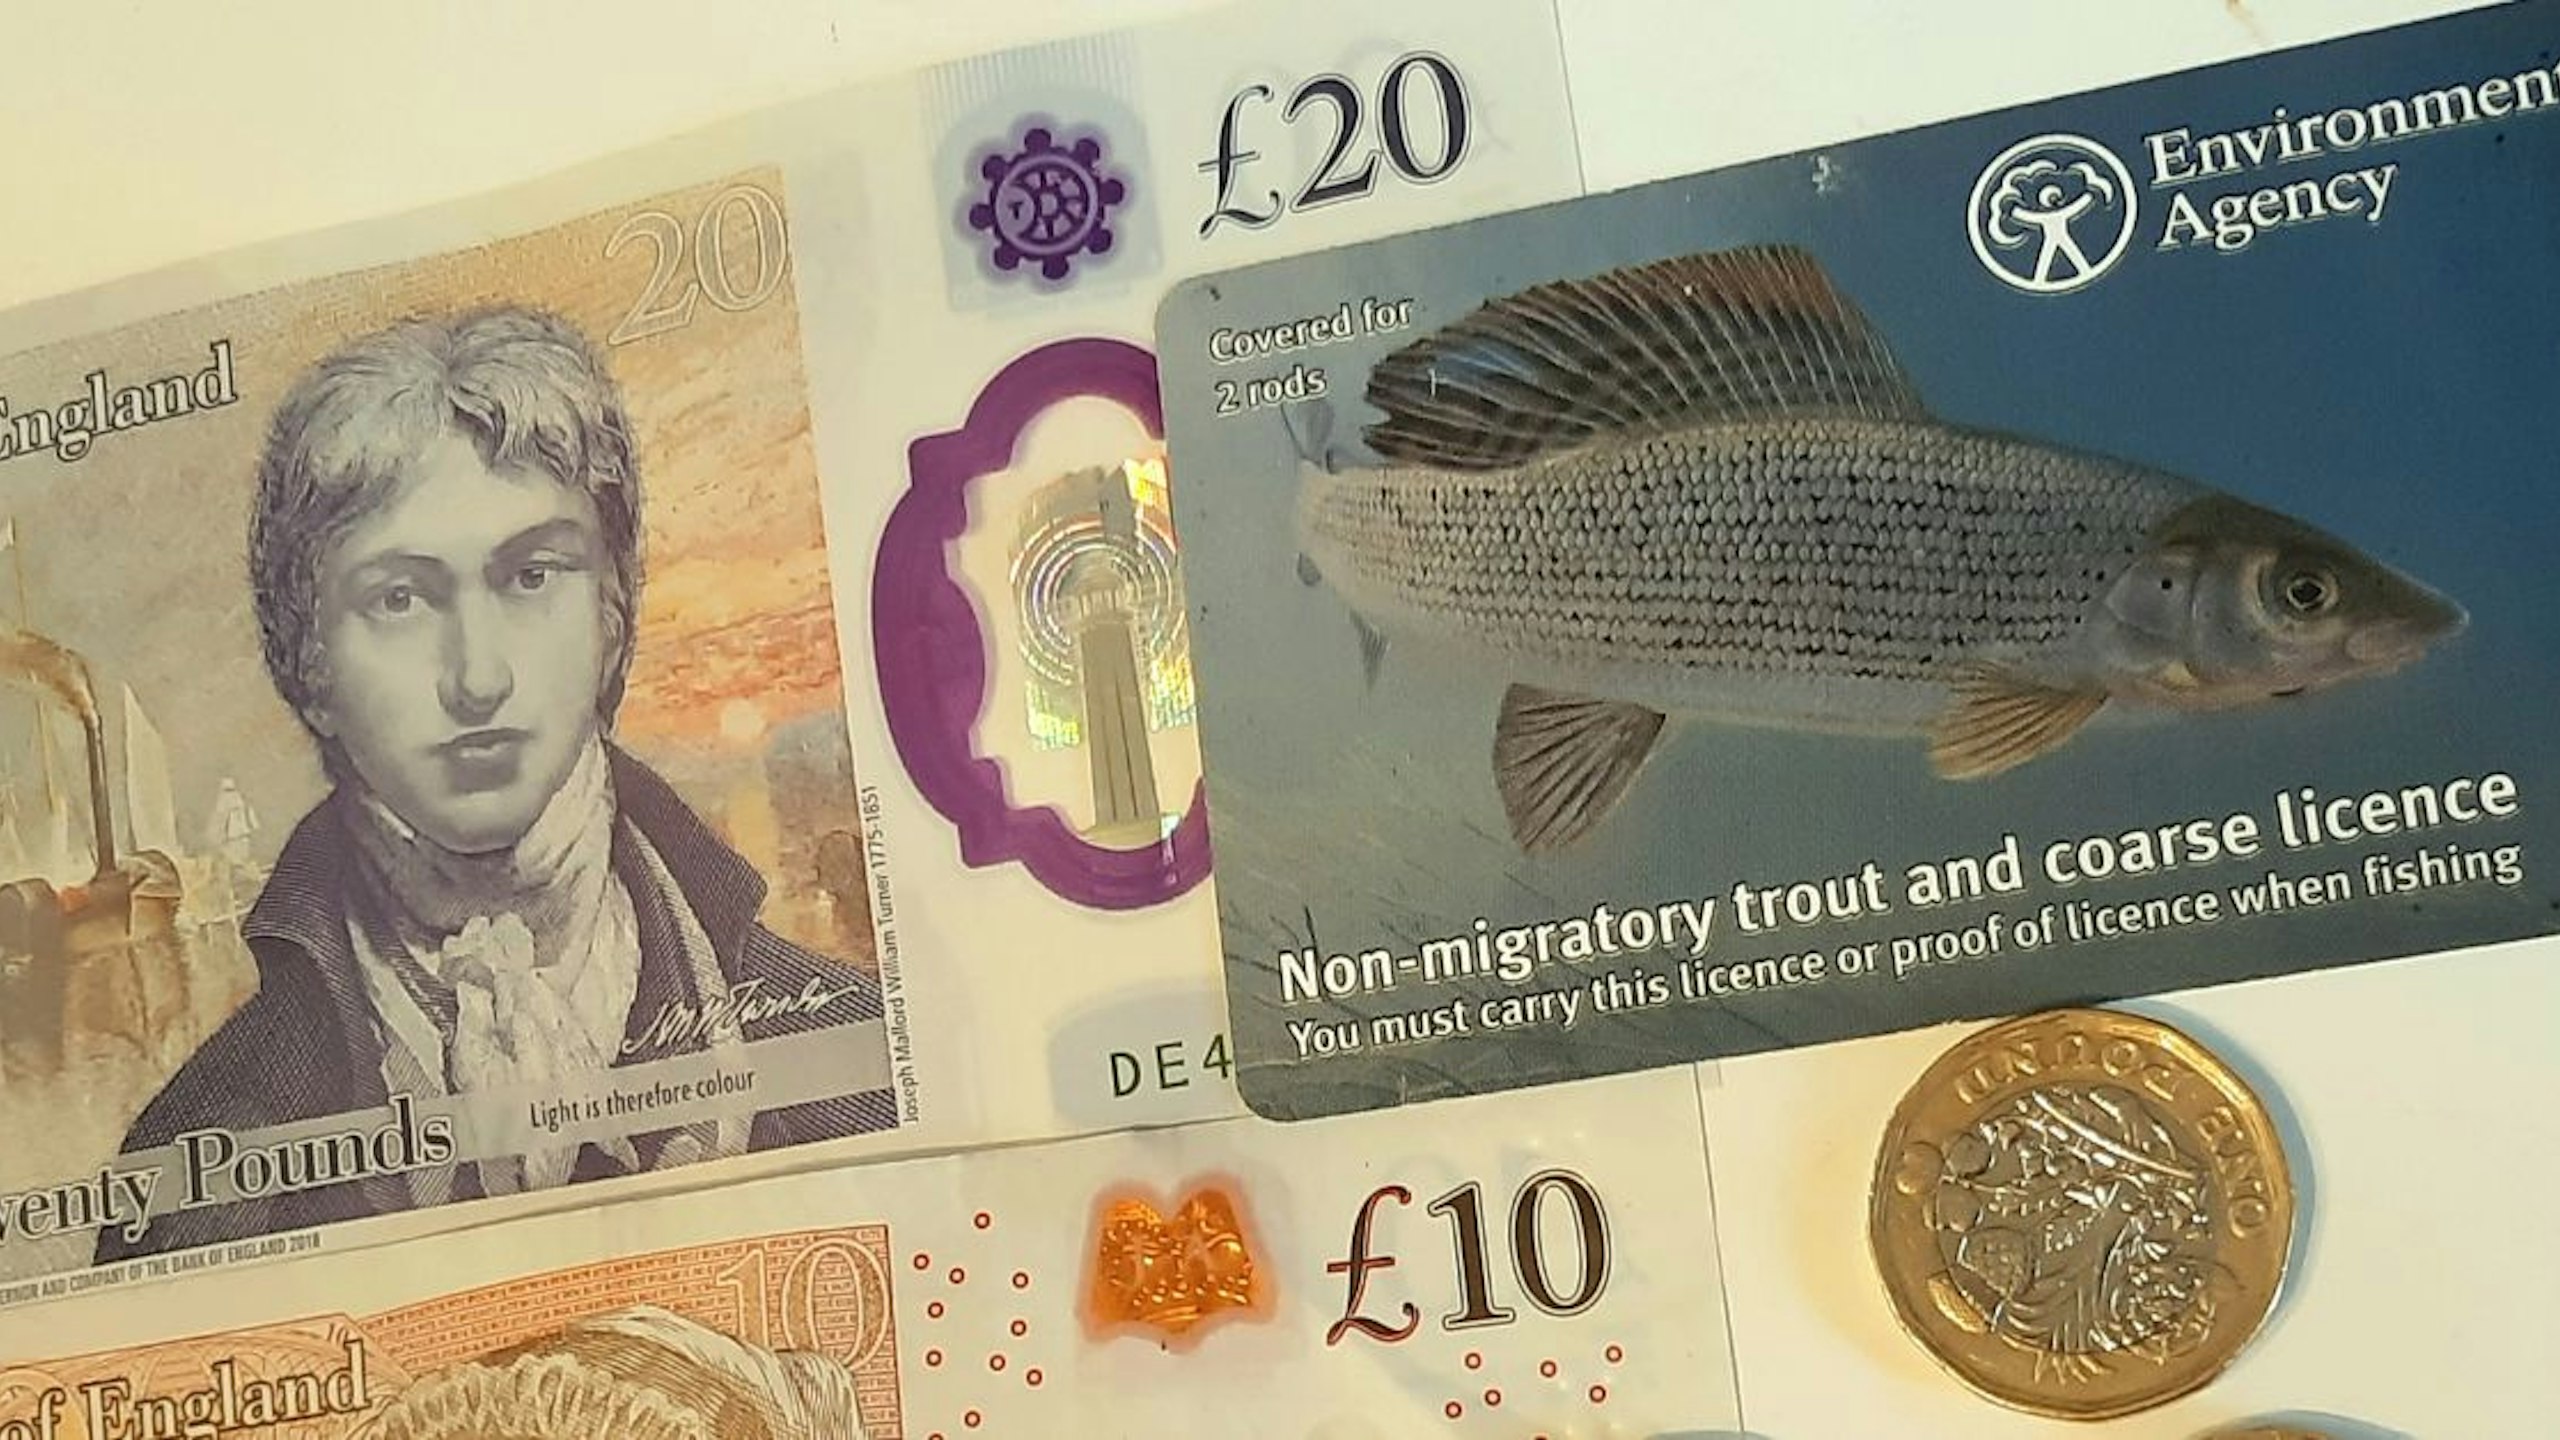
The Environment Agency (EA) has revealed that it generated £24.15 million from rod licence sales in the year to April 2025 – the highest figure since lockdown and the second highest this century,
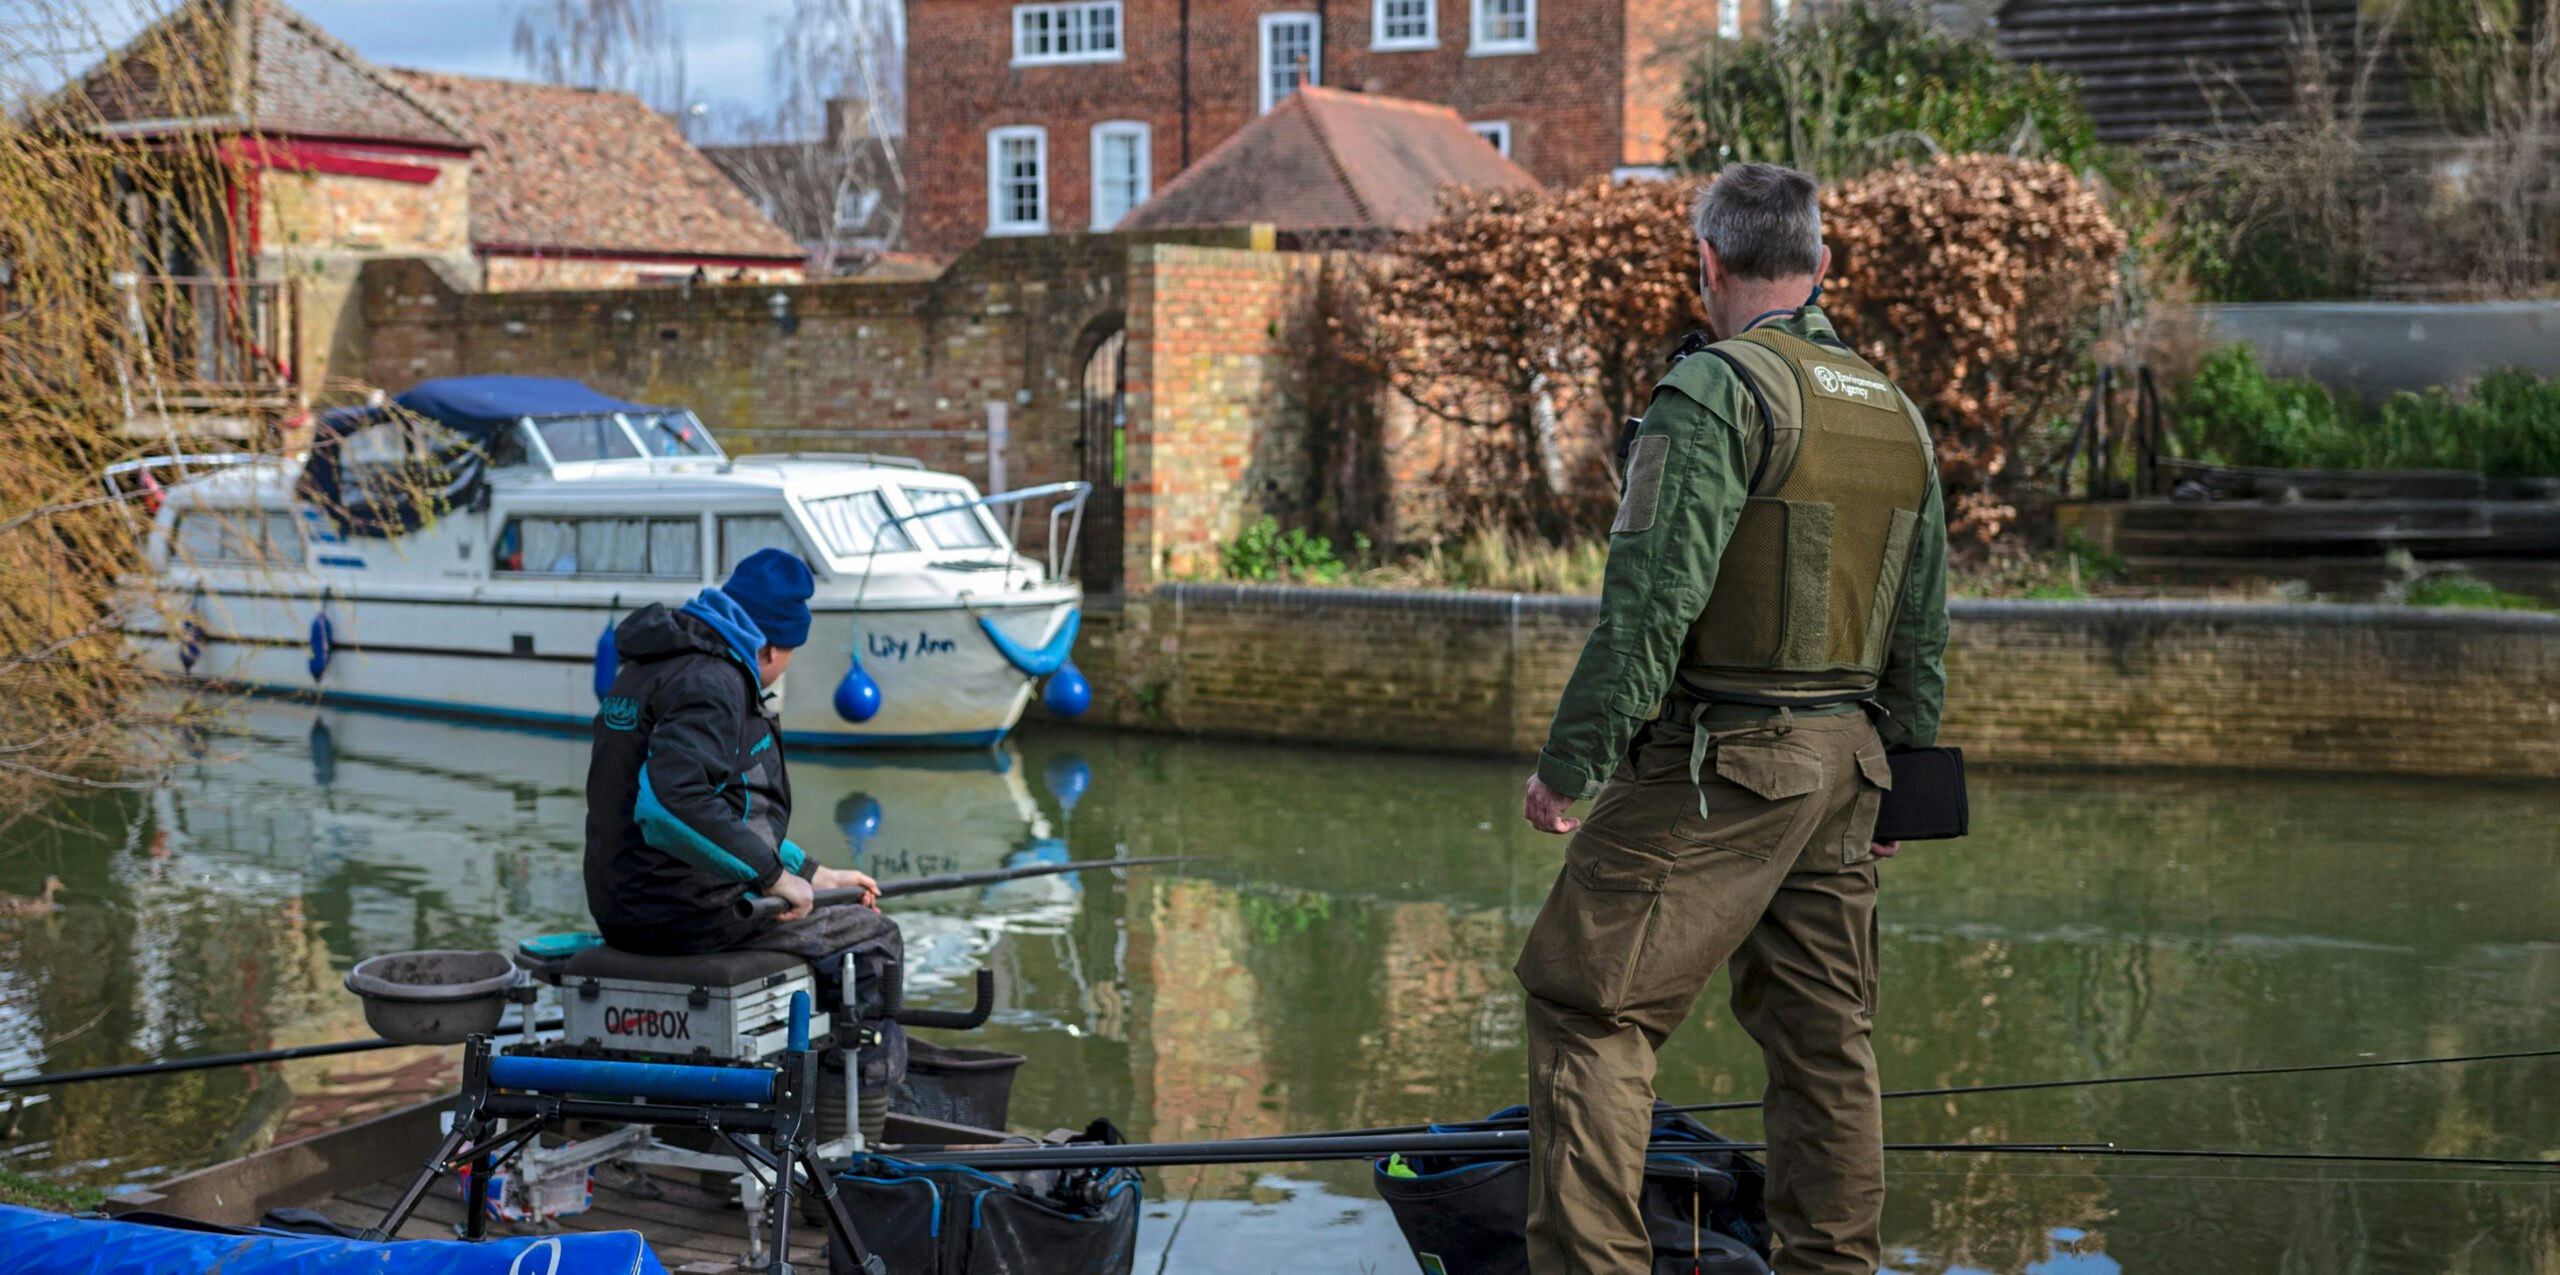
The upturn has been attributed to an incremental increase in the cost of a licence, plus a rise in sales for the second year in a row. The EA also received a £1.45m grant from central government. Enforcement was a key area in which the money was used, with 60,320 licences checked and 769 successful prosecutions made.
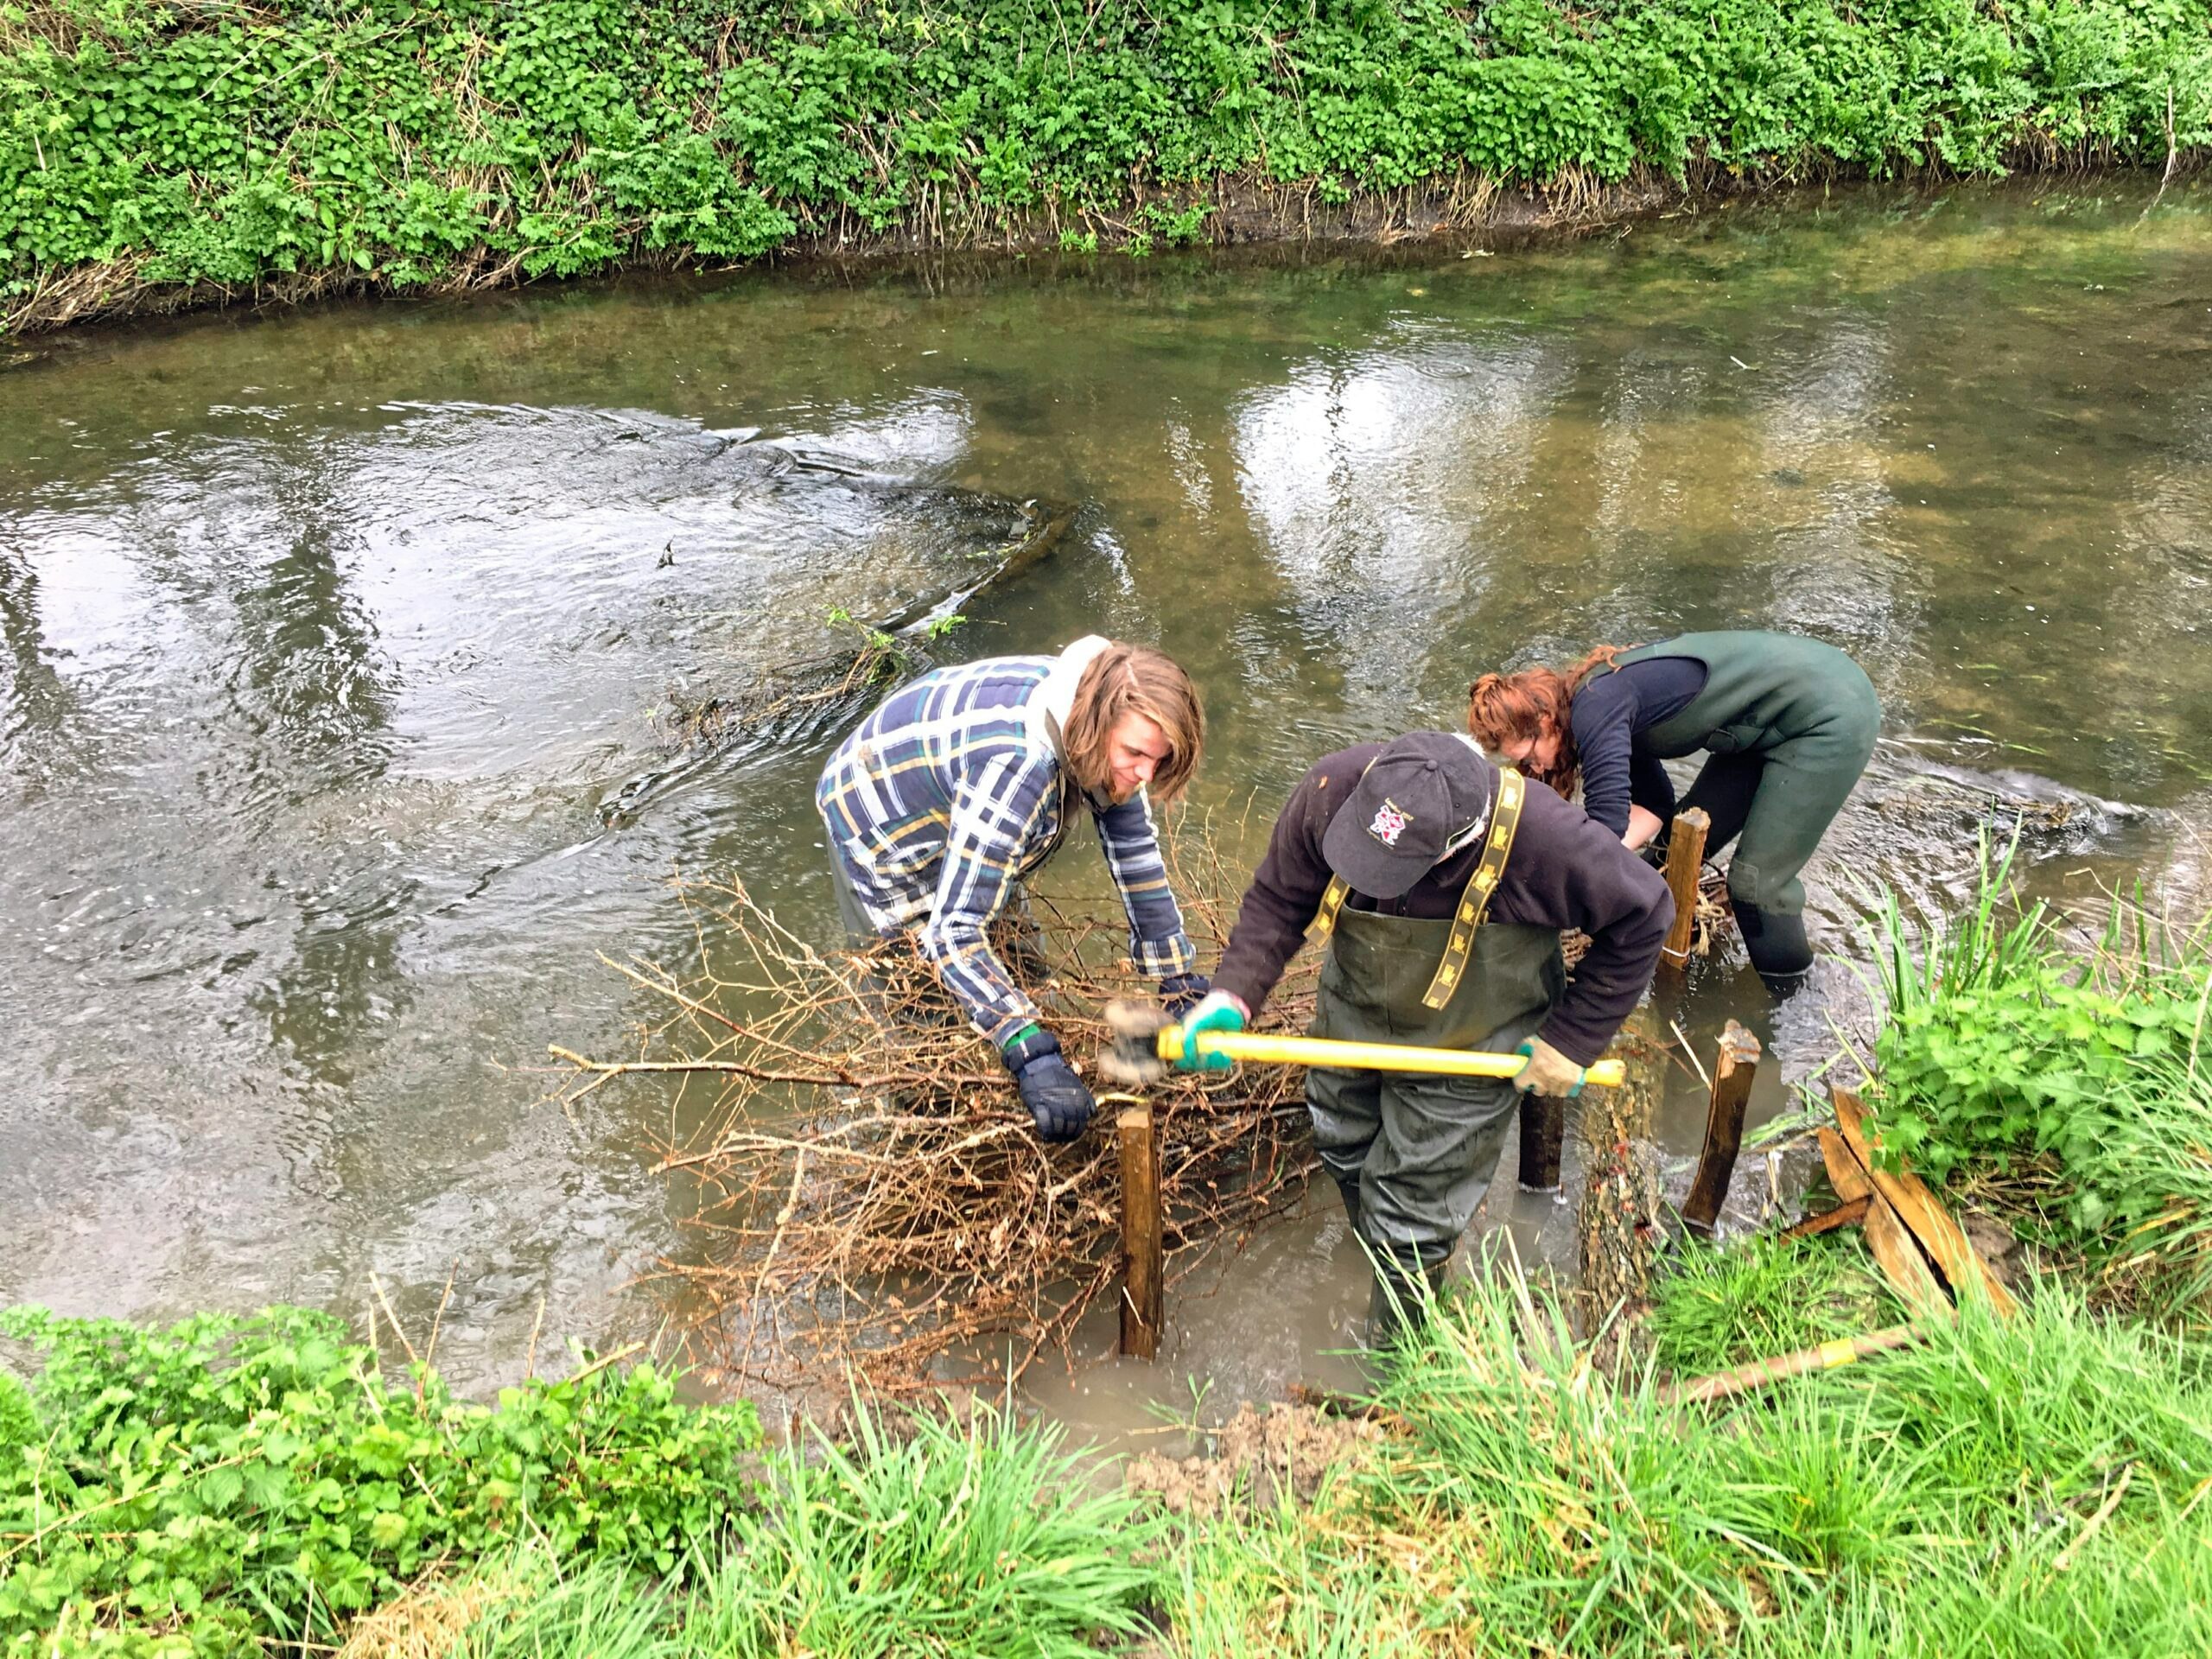
Fisheries also benefitted, not only through the near half-a-million fish stocked, but also through habitat improvements on 675km of river and 204 hectares of stillwater fisheries.
The EA also worked with a wide range of partners, as a spokesperson revealed.
“By working in partnership we can often achieve more through our rod licence investment via match funding, and better outcomes for fish and anglers.
“We worked with over 350 partners in 2024 and 2025, including the Angling Trust, Wild Trout Trust, the Institute of Fisheries Management, and local rivers trusts, angling clubs and charities. This included projects to improve fish stocks and habitats, new facilities for anglers and making fisheries more accessible, and promoting angling by giving more people the opportunity to try fishing.”
Numbers in focus
Voluntary bailiffs completed 16,631 patrols, which culminated in around 43,705 volunteer hours on the bank!
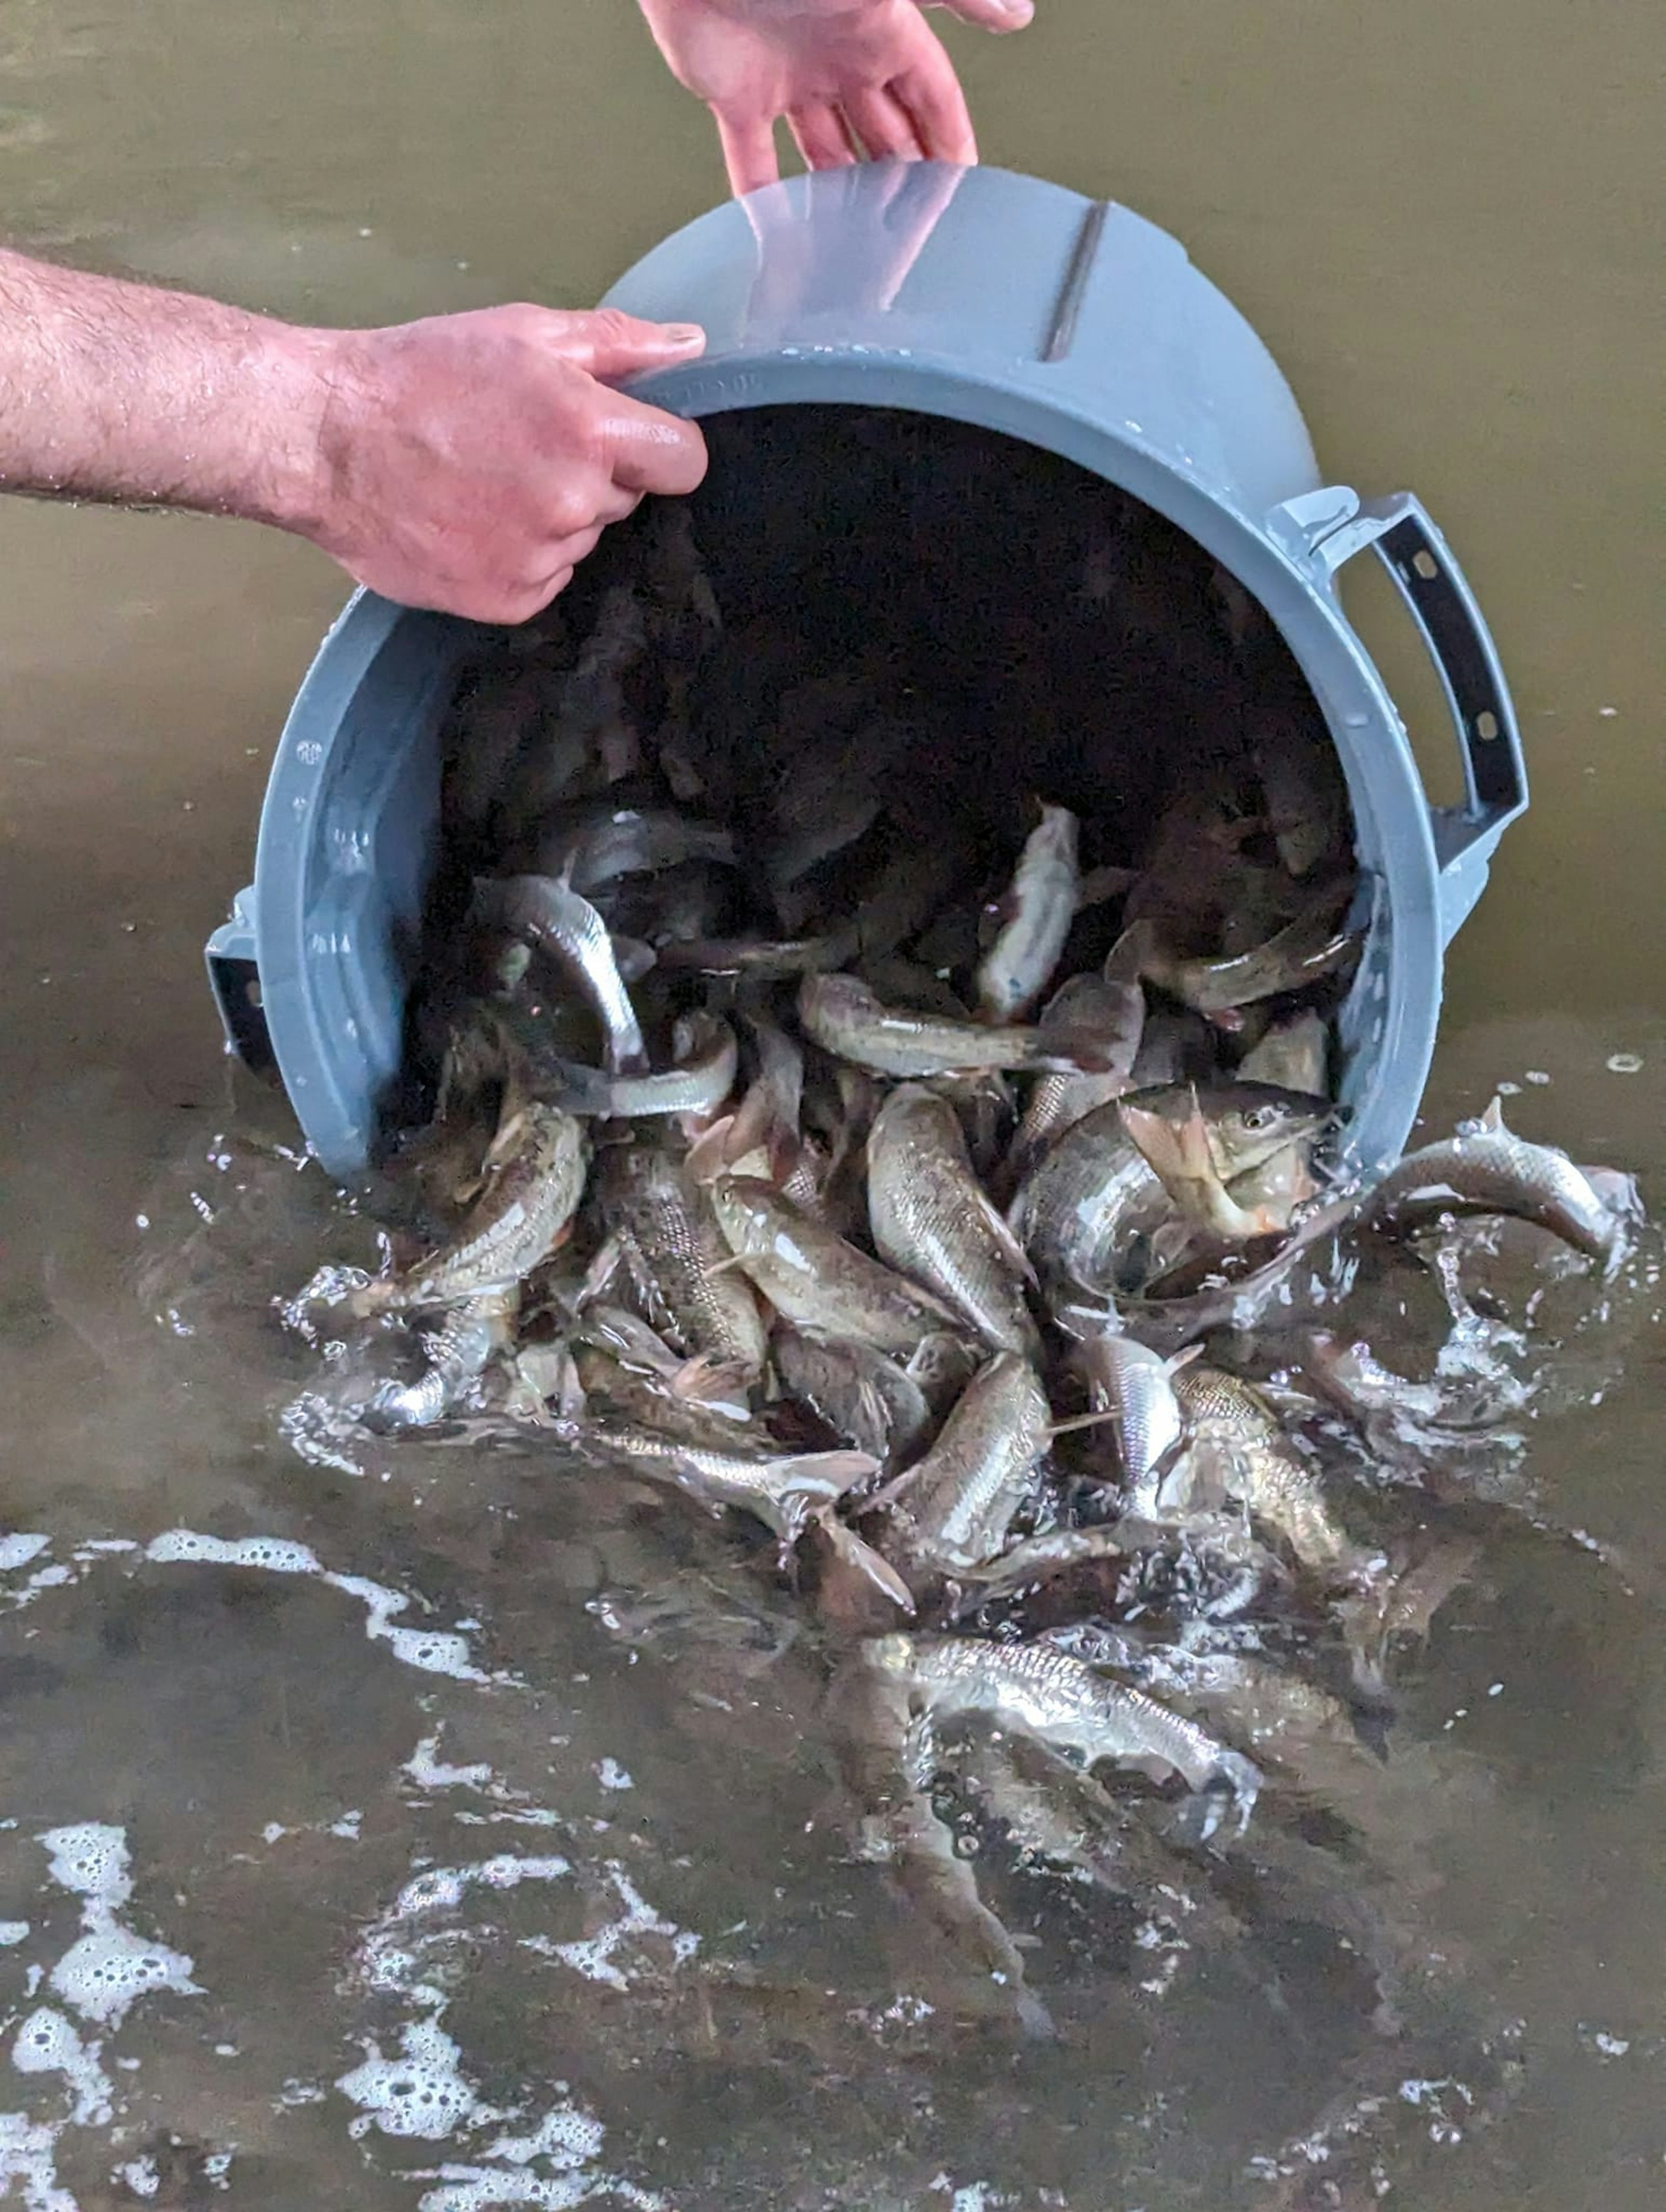
This year saw a total of 478,937 fish stocked into rivers and stillwaters around the country, made up of:
Barbel – 136,150
Roach – 86,190
Chub – 54,830
Grayling – 48,359
Bream – 48,274
Dace – 47,420
Tench – 40,050
Crucians – 25,915
Rudd – 23,300
There were 357,149 fish introduced into rivers and 153,339 into stillwaters, with a regional breakdown of:
Anglian – 144,750
North East – 141,820
South East – 83,569
Midlands – 75,990
South West – 38,459
North West – 25,900
YOU CAN READ THE FULL ANNUAL REPORT HERE!